Are You Stuck in the “Excel Hell” Loop? Here’s Why Your Career Is Stalling…
Every day, talented accountants and finance professionals across Pakistan are trapped in outdated workflows that kill productivity and limit career growth:
The Daily Struggle:
Spending 6+ hours copying and pasting data between multiple Excel spreadsheets
Creating basic financial reports that executives barely glance at
Watching younger colleagues get promoted because they know “data visualization”
Missing family time due to endless manual data entry and report preparation
Feeling replaceable because your skills haven’t evolved with technology
The Harsh Reality: While you’re buried in spreadsheets, companies are desperately searching for professionals who can transform raw data into strategic business insights using Microsoft Power BI and advanced data visualization tools.
The Market Demand is EXPLODING: Job postings requiring Power BI skills have increased by 34% year-over-year. Companies are willing to pay premium salaries for professionals who can create interactive dashboards and provide data-driven decision support.
What if there was a way to automate 90% of your manual work, create executive-level reports in minutes, and become the most valuable person in your organization?
Well, Power BI exactly does that.
Let’s explore further what it is and what it does?
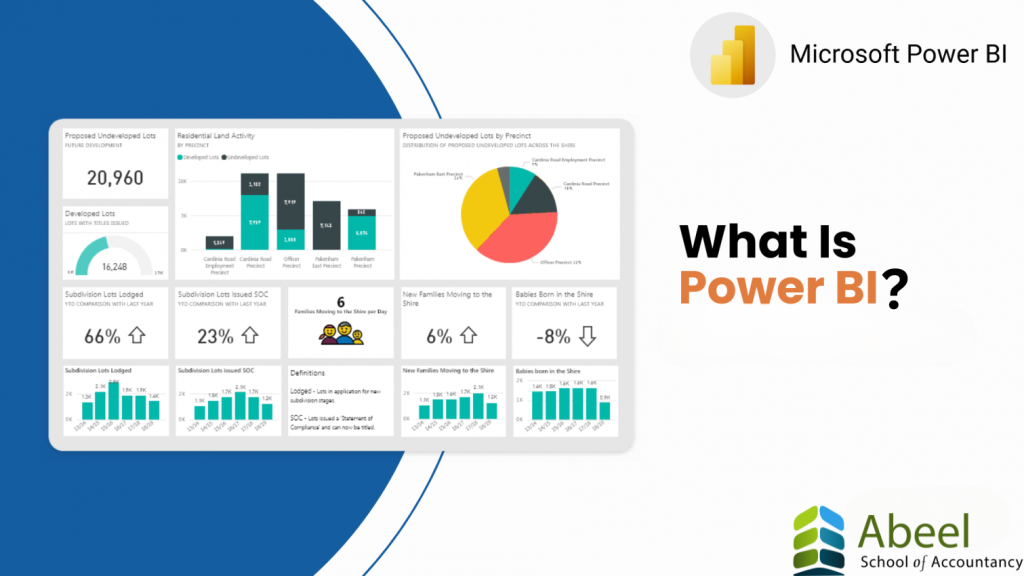
What is Microsoft Power BI?
Microsoft Power BI is the world’s leading business intelligence and data visualization platform used by over 97% of Fortune 500 companies. Think of it as your personal data transformation superpower.
Here’s How Power BI Revolutionizes Accounting Work:
Data Integration Magic: Power BI connects to every data source imaginable – Excel files, accounting software like QuickBooks and SAP, cloud databases, web services, and even social media platforms. No more manual data gathering from 10 different systems.
Automated Data Cleaning: Raw financial data is often messy with errors, duplicates, and inconsistencies. Power BI’s Power Query feature automatically cleans, transforms, and standardizes your data, eliminating hours of manual preparation work.
Interactive Dashboard Creation: Transform boring spreadsheet reports into stunning, interactive dashboards with charts, graphs, maps, and real-time KPIs that executives actually want to see and use for decision-making.
Natural Language Queries: Ask questions in plain English like “What were our top 5 customers last quarter?” and Power BI instantly generates visual answers. No complex formulas or pivot tables required.
Real-time Collaboration: Share interactive reports with stakeholders who can filter, drill down, and explore data themselves, reducing your workload while increasing report engagement.
Mobile Accessibility: Your dashboards work perfectly on phones and tablets, allowing executives to access critical financial insights anywhere, anytime.
What are the Prerequisites to Learn Power BI?
Our Microsoft Power BI training course is designed for professionals from all backgrounds.
You Don’t need:
Specific university degrees in data science or IT
Years of programming or database experience
Previous business intelligence or analytics training
Expensive software licenses (we provide everything)
What You Do Need:
Basic Microsoft Excel Knowledge: Ability to create simple formulas and work with data tables
Windows Computer Access: For Power BI Desktop installation and practice
Willingness to Learn: Commitment to complete assignments and practice exercises
Professional Ambition: Desire to advance your career and increase earning potential
Perfect For:
Chartered Accountants (ACCA, CA, CPA) seeking modern skills
Finance managers wanting to automate reporting processes
Business analysts looking to specialize in data visualization
Accounting students preparing for competitive job market
CFOs and finance directors needing strategic insight tools
Entrepreneurs wanting to understand their business data better
Detailed Microsoft Power BI Training Curriculum By ASAACCA (Modules & Other Details!)
Module 1: Power BI Fundamentals (2 Hours)
What You’ll Master:
Understanding business intelligence concepts and terminology
Power BI ecosystem overview: Desktop, Service, Mobile, and Premium
Installing and configuring Power BI Desktop for optimal performance
Navigating the Power BI interface and understanding workflow
Best practices for data visualization and dashboard design principles
Module 2: Data Connectivity and Power Query (2.5 Hours)
Advanced Data Management Skills:
Connecting to 50+ data sources including Excel, SQL Server, web APIs
Power Query Editor for data transformation and cleaning
Merging and appending data from multiple sources
Creating custom columns and calculated fields
Handling missing data and error management
Automating data refresh schedules for real-time reporting
Module 3: Data Modeling and Relationships (2 Hours)
Building Robust Data Foundations:
Creating efficient data models for large datasets
Understanding star schema and snowflake schema design
Establishing relationships between multiple data tables
Managing data types and formatting for optimal performance
Creating calculated tables and managing data lineage
Module 4: DAX Formulas and Advanced Calculations (2.5 Hours)
Powerful Analytics and Calculations:
DAX syntax and function categories
Creating measures for complex financial calculations
Time intelligence functions for period comparisons
Advanced filtering and context manipulation
Custom KPI creation and performance monitoring
Troubleshooting common DAX errors and optimization
Module 5: Interactive Visualizations and Dashboard Design (2 Hours)
Creating Compelling Visual Stories:
Choosing the right chart types for different data scenarios
Advanced formatting techniques for professional appearance
Creating interactive filters and slicers for user exploration
Designing mobile-responsive dashboards
Implementing drill-through functionality and bookmarks
Custom visual integration and marketplace extensions
Module 6: Publishing, Sharing, and Collaboration (1 Hour)
Enterprise-Level Deployment:
Publishing reports to Power BI Service workspace
Setting up row-level security for sensitive financial data
Creating and managing user access permissions
Scheduling automatic data refresh and email subscriptions
Embedding reports in SharePoint and other business applications
Mobile app configuration and offline access setup
Details
Course Duration and Schedule
Total Training Hours: 12 hours of comprehensive video content
Course Duration: 4-6 weeks (flexible pacing)
Live Sessions: 2 hours of personalized 1-on-1 mentoring
Self-Study Time: 2-3 hours weekly recommended
Assessment Time: 4 hours for tests and final evaluation
Learning Resources Provided
HD Video Lessons: Crystal clear screen recordings with step-by-step instructions
Practice Datasets: Real business data for hands-on exercises
Cheat Sheets: Quick reference guides for DAX formulas and functions
Case Study Workbooks: Complete solutions for 5 industry scenarios
Assessment and Certification Process
Continuous Assessment Approach:
Module Quizzes: Test understanding after each major topic
Practical Assignments: Build dashboards using provided datasets
Peer Review Projects: Get feedback from fellow students
Mock Certification Exams: Practice tests mimicking Microsoft’s actual exam format
Final Portfolio Project: Create a comprehensive business intelligence solution
Certification Requirements:
Complete all 12 hours of video content
Pass all module assessments with 80% minimum score
Successfully complete final portfolio project
Participate in live mentoring sessions
Demonstrate practical Power BI dashboard creation skills
Technical Requirements
Software: Power BI Desktop (free download, we guide installation)
Hardware: Windows computer with 4GB RAM minimum
Internet: Stable connection for video streaming and cloud features
Prerequisites: Basic Microsoft Excel knowledge
Career Growth Opportunities with Power BI Certification
High-Demand Job Market for Data Visualization Professionals
The business intelligence and data analytics job market is experiencing unprecedented growth. Companies across Pakistan and globally are actively recruiting professionals with Microsoft Power BI expertise.
In-Demand Job Titles:
Business Intelligence Analyst ($70,000 – $95,000)
Data Visualization Specialist ($65,000 – $90,000)
Financial Data Analyst ($75,000 – $110,000)
Power BI Developer ($80,000 – $120,000)
Senior Business Intelligence Consultant ($100,000 – $150,000)
Freelancing Opportunities
Dashboard creation projects: $2,000 – $8,000 per project
Data migration and setup: $3,000 – $12,000 per client
Perfect work-life balance with flexible scheduling
Corporate Career Advancement
Power BI skills position you for rapid promotion within organizations:
Junior to Senior Analyst: Average 18-month progression
Analyst to Manager: Typically 2-3 years with BI expertise
Manager to Director: Power BI dashboards showcase strategic thinking
Cross-Department Opportunities: Every department needs data insights
Remote Work Opportunities
Power BI expertise opens doors to international remote positions:
US and European companies hiring Pakistani professionals
Time zone advantages for global collaboration
Higher international salary standards
Opportunity to work with cutting-edge technologies
Why Abeel School of Accountancy is Pakistan’s #1 Choice for Microsoft Power BI Training?
15+ Years of Excellence: Abeel School of Accountancy has been nurturing accounting professionals since 2009, understanding unique challenges Pakistani accountants face while maintaining international standards.
Microsoft Certified Training Partner: Officially recognized by Microsoft as a certified training provider, ensuring authentic, up-to-date Power BI education aligned with global certification standards.
Proven Success Record: 500+ successful graduates, 94% certification pass rate on first attempt, 78% salary increase within 6 months, and 350+ LinkedIn recommendations from satisfied students.
Industry-Focused Curriculum: Unlike generic online courses, our Power BI training is specifically designed for accounting and finance professionals with every example relating directly to financial data analysis, budgeting, and forecasting.
Comprehensive Support System: Pre-course orientation, during-course WhatsApp support, post-course career guidance, lifetime alumni network access, and job placement assistance through our corporate partnerships
Why is Jaffar Tayar the Perfect Power BI Trainer for Accountants?‘
You should learn from him because: Real-World Experience: 14+ years of hands-on experience implementing Power BI solutions across manufacturing, retail, healthcare, and financial services sectors. Jaffar understands exactly how accountants work and what challenges you face daily.
Teaching Excellence: Has personally trained over 500 accounting and finance professionals who have successfully transitioned to higher-paying data analyst and business intelligence roles. Industry Recognition: Regular speaker at ACCA events and Microsoft technology conferences.
Featured in leading accounting publications for innovative use of Power BI in financial reporting. Student Success Rate: 94% of Jaffar’s students pass Microsoft Power BI certification exams on their first attempt and 78% receive salary increases within 6 months of course completion.
I don’t just teach Power BI features – I show accountants exactly how to use these tools to become strategic business partners and command the respect and salary they deserve. – Jaffar Tayyar
6 Powerful Ways Microsoft Power BI Training Will Transform Your Professional Life
Automate 90% of Manual Work: Stop copying data between systems. Power BI connects to all your sources automatically – accounting software, Excel, databases. Students reduce reporting time by 80-90%.
Create Executive-Level Interactive Dashboards: Build dynamic visualizations that executives actually use for decisions. Move from static Excel reports to compelling data stories that get attention.
Command Premium Salaries: Power BI professionals earn significantly more:
Business Intelligence Analyst: PKR 80,000-150,000 monthly
Senior Financial Analyst: PKR 100,000-200,000 monthly
Freelance Consultant: PKR 8,000-25,000 per day
Unlock Freelancing Opportunities: Massive demand for Power BI experts. Our graduates earn $50-150/hour with international clients. Perfect for remote work and location independence.
Become Strategic Business Partner: Move beyond number-crunching to strategic advisory. Use advanced analytics to predict trends and drive business growth decisions.
Future-Proof Your Career: While basic accounting gets automated, data visualization skills become more valuable. Master the tools driving digital transformation across all industries.
Get Enrolled Now!
FAQ’s
Q1: Can I learn Power BI without a programming background?
A: Absolutely! Power BI is designed for business users, not programmers. If you can use Excel formulas, you can master Power BI. Our course starts with basics and builds gradually.
Q2: Will my current computer handle Power BI software?
A: Power BI Desktop runs on any Windows computer with 4GB RAM (8GB recommended). We provide complete installation guidance and technical setup support.
Q3: How long before I can start applying for Power BI jobs?
A: Most students are job-ready within 6-8 weeks after completing our course. You’ll have a portfolio of real dashboards and professional certification to showcase your skills.
Q4: Is the certification recognized by employers globally?
A: Yes! Our “Certified Professional of Power BI” certificate is industry-recognized. Many graduates use it to land jobs with multinational companies and international remote positions.
Q5. What if I get stuck during the course?
A: You get lifetime access to instructor support via WhatsApp/email, plus live 1-on-1 sessions with Jaffar. Our alumni network also provides peer support 24/7.
Q6: Can I balance this with my full-time job?
A: Designed for working professionals! Pre-recorded videos allow flexible scheduling. Most students study 2-3 hours weekly and complete everything while maintaining their regular jobs.
Q7. Will this actually increase my salary or is it just marketing?
A: 78% of our graduates receive salary increases within 6 months (verified through alumni surveys). We track and share real success stories, not marketing promises.